Profiling in Python: Who called the function?
Question:
I’m profiling in Python using cProfile. I found a function that takes a lot of CPU time. How do I find out which function is calling this heavy function the most?
EDIT:
I’ll settle for a workaround: Can I write a Python line inside that heavy function that will print the name of the function that called it?
Answers:
That may not answer your question directly, but will definitely help. If use the profiler with option –sort cumulative it will sort the functions by cumulative time. Which is helpful to detect not only heavy functions but the functions that call them.
python -m cProfile --sort cumulative myScript.py
There is a workaround to get the caller function:
import inspect
print inspect.getframeinfo(inspect.currentframe().f_back)[2]
You can add as many f_back as you want in case you want the caller caller etc
If you want to calculate frequent calls you can do this:
record = {}

caller = inspect.getframeinfo(inspect.currentframe().f_back)[2]
record[caller] = record.get(caller, 0) + 1
Then print them by order of frequency:
print sorted(record.items(), key=lambda a: a[1])
I have not used cProfile myself, but most profilers give you a call hierarchy.
Googling I found this slides about cProfile. Maybe that helps. Page 6 looks like cProfile does provide a hierarchy.
inspect.stack() will give you the current caller stack.
I almost always view the output of the cProfile module using Gprof2dot, basically it converts the output into a graphvis graph (a .dot file), for example:
It makes it very easy to determine which function is slowest, and which function[s] called it.
Usage is:
python -m cProfile -o output.pstats path/to/your/script arg1 arg2
gprof2dot.py -f pstats output.pstats | dot -Tpng -o output.png
Sorry I’m not familiar with Python, but there’s a general method that works, assuming you can manually interrupt execution at a random time.
Just do so, and display the call stack. It will tell you, with high probability, what you want to know. If you want to be more certain, just do it several times.
It works because the guilty caller has to be on the call stack for the fraction of time that’s being wasted, which exposes it to your interrupts for that much of the time, whether it is spread over many short calls or a few lengthy ones.
NOTE: This process is more like diagnosis than measurement. Suppose that bad call is wasting 90% of the time. Then each time you halt it, the probability is 90% that the bad call statement is right there on the call stack for you to see, and you will be able to see that it’s bad. However, if you want to exactly measure the wastage, that’s a different problem. For that, you will need a lot more samples, to see what % of them contain that call. Or alternatively, just fix the guilty call, clock the speedup, and that will tell you exactly what the wastage was.
You might want to take a look at pycallgraph.
Pycscope does this. I just found it today, so I can’t speak to how good it is, but the few examples I’ve tried have been pretty good (though not perfect).
https://pypi.python.org/pypi/pycscope/
You would use this to generate a cscope file and then a cscope plugin from an editor, VIM specifically. I tried using it with vanilla cscope, it seems that plain cscope gets confused.
It is possible to do it using profiler cProfile in standard library.
In pstats.Stats (the profiler result) there is method print_callees (or alternatively print_callers).
Example code:
import cProfile, pstats
pr = cProfile.Profile()
pr.enable()

# ... do something ...

pr.disable()
ps = pstats.Stats(pr).strip_dirs().sort_stats('cumulative')
ps.print_callees()
Result will be something like:
Function                           called...
                                       ncalls  tottime  cumtime
ElementTree.py:1517(_start_list)   ->   24093    0.048    0.124  ElementTree.py:1399(start)
                                        46429    0.015    0.041  ElementTree.py:1490(_fixtext)
                                        70522    0.015    0.015  ElementTree.py:1497(_fixname)
ElementTree.py:1527(_data)         ->   47827    0.017    0.026  ElementTree.py:1388(data)
                                        47827    0.018    0.053  ElementTree.py:1490(_fixtext)
On the left you have the caller, on the right you have the callee.
(for example _fixtext was called from _data 47827 times and from _start_list 46429 times)
See also:
- docs.python.org/..#print_callees – show call hierarchy. Group by the caller. (used above)
- docs.python.org/..#print_callers – show call hierarchy. Group by the callee.
Couple of notes:
- Your code needs to be edited for this (insert those profile statements).
(i.e. not possible to use from command line like python -m cProfile myscript.py. Though it is possible to write separate script for that)
- A bit unrelated, but
strip_dirs() must go before sort_stats() (otherwise sorting does not work)
I’m profiling in Python using cProfile. I found a function that takes a lot of CPU time. How do I find out which function is calling this heavy function the most?
EDIT:
I’ll settle for a workaround: Can I write a Python line inside that heavy function that will print the name of the function that called it?
That may not answer your question directly, but will definitely help. If use the profiler with option –sort cumulative it will sort the functions by cumulative time. Which is helpful to detect not only heavy functions but the functions that call them.
python -m cProfile --sort cumulative myScript.py
There is a workaround to get the caller function:
import inspect
print inspect.getframeinfo(inspect.currentframe().f_back)[2]
You can add as many f_back as you want in case you want the caller caller etc
If you want to calculate frequent calls you can do this:
record = {}
caller = inspect.getframeinfo(inspect.currentframe().f_back)[2]
record[caller] = record.get(caller, 0) + 1
Then print them by order of frequency:
print sorted(record.items(), key=lambda a: a[1])
I have not used cProfile myself, but most profilers give you a call hierarchy.
Googling I found this slides about cProfile. Maybe that helps. Page 6 looks like cProfile does provide a hierarchy.
inspect.stack() will give you the current caller stack.
I almost always view the output of the cProfile module using Gprof2dot, basically it converts the output into a graphvis graph (a .dot file), for example:
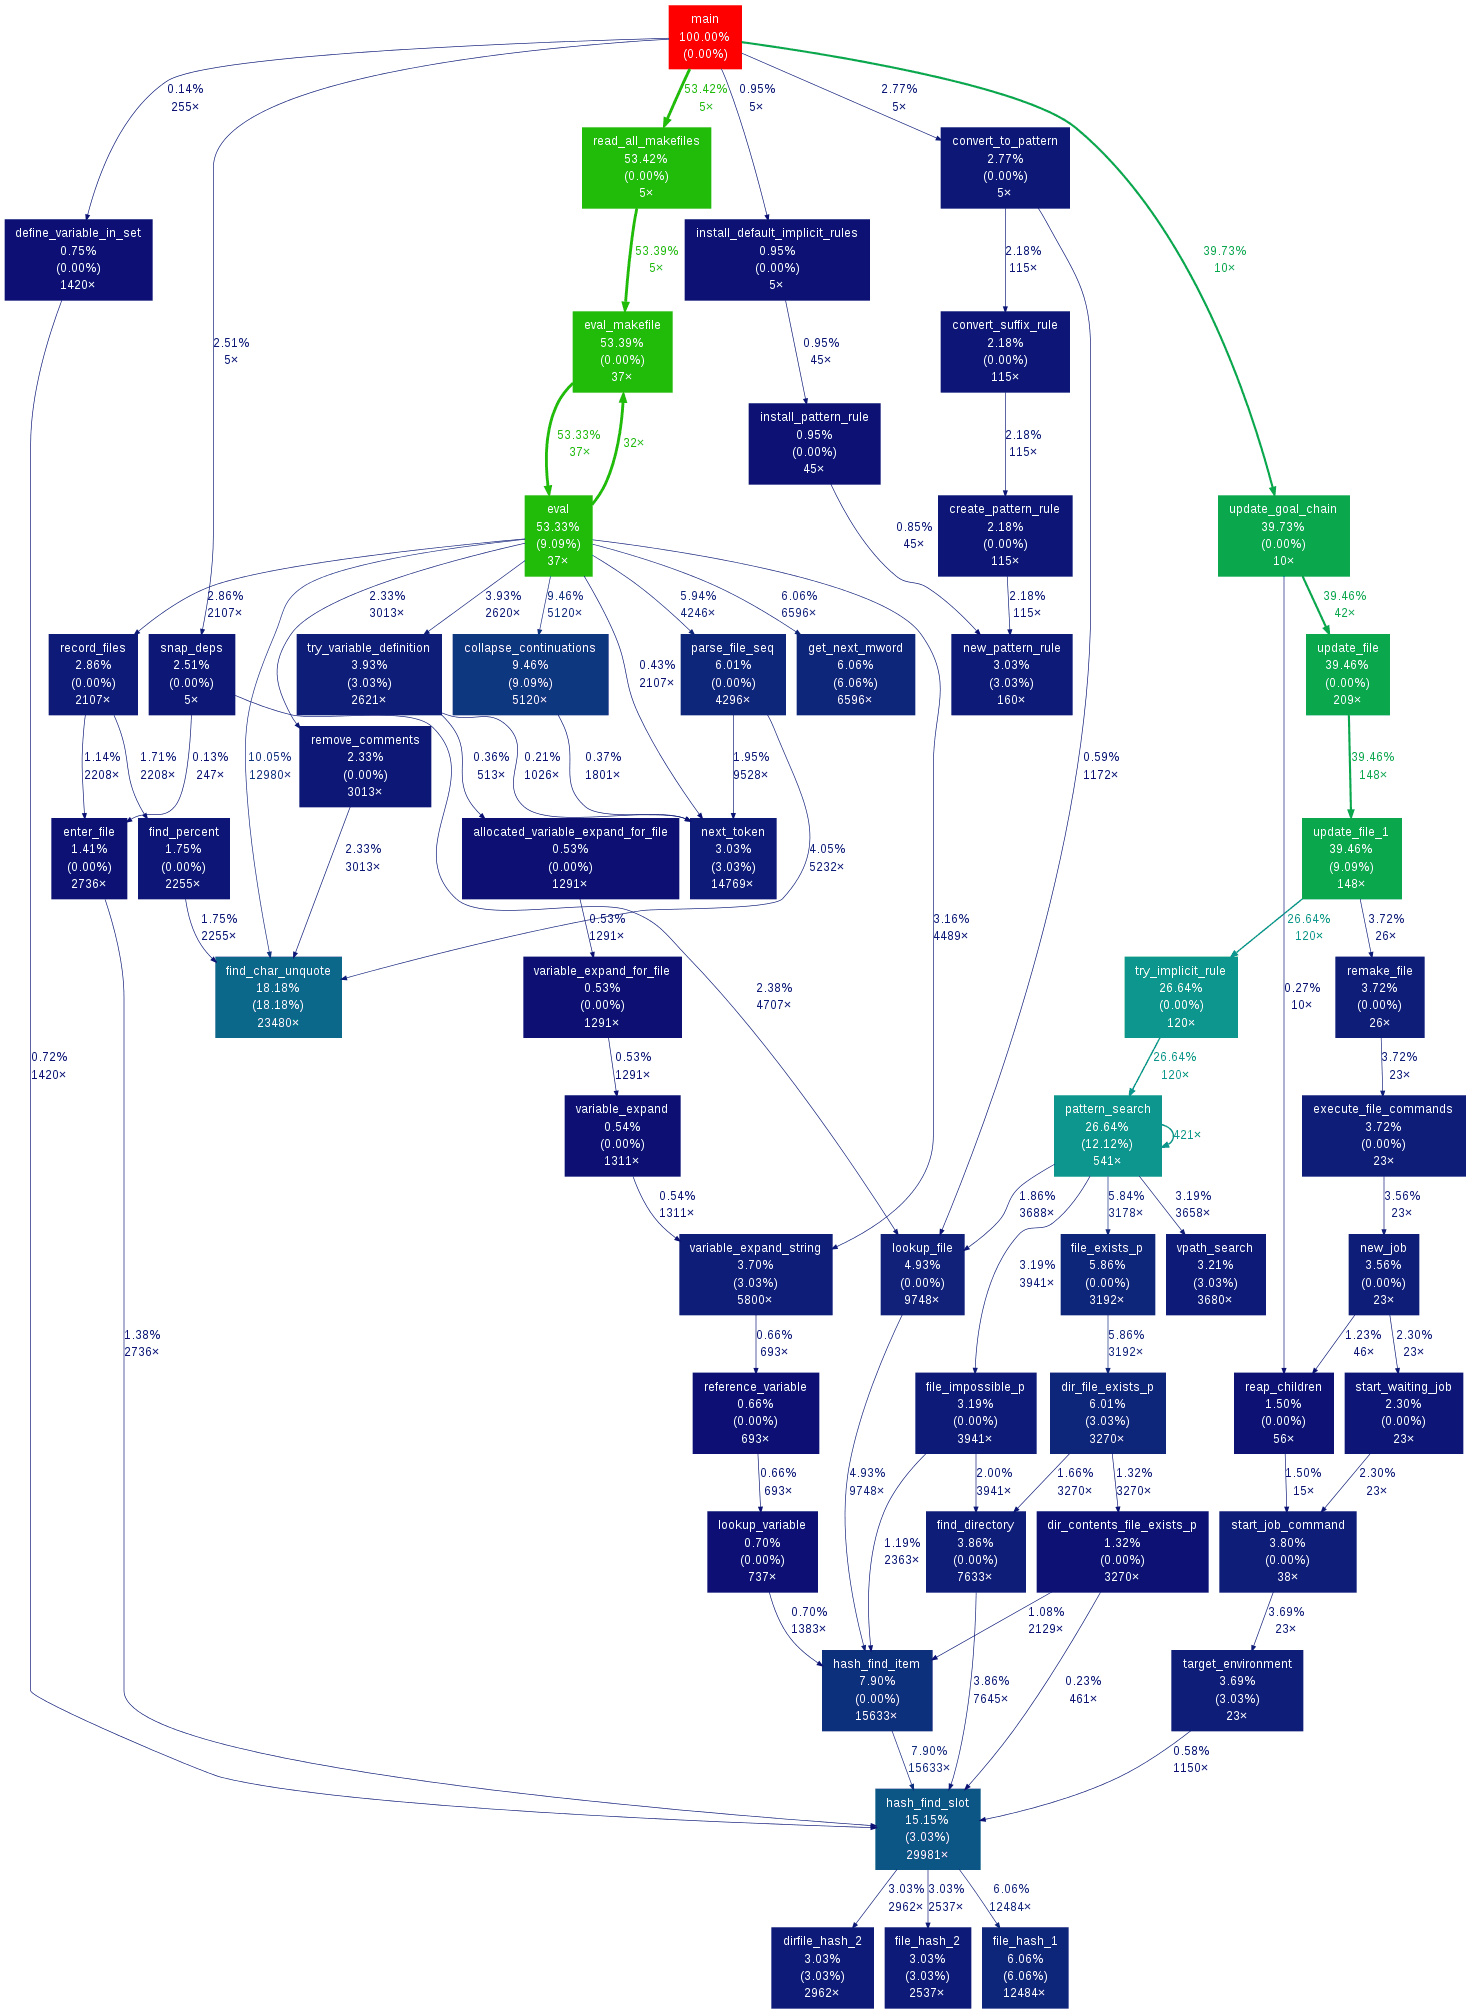
It makes it very easy to determine which function is slowest, and which function[s] called it.
Usage is:
python -m cProfile -o output.pstats path/to/your/script arg1 arg2
gprof2dot.py -f pstats output.pstats | dot -Tpng -o output.png
Sorry I’m not familiar with Python, but there’s a general method that works, assuming you can manually interrupt execution at a random time.
Just do so, and display the call stack. It will tell you, with high probability, what you want to know. If you want to be more certain, just do it several times.
It works because the guilty caller has to be on the call stack for the fraction of time that’s being wasted, which exposes it to your interrupts for that much of the time, whether it is spread over many short calls or a few lengthy ones.
NOTE: This process is more like diagnosis than measurement. Suppose that bad call is wasting 90% of the time. Then each time you halt it, the probability is 90% that the bad call statement is right there on the call stack for you to see, and you will be able to see that it’s bad. However, if you want to exactly measure the wastage, that’s a different problem. For that, you will need a lot more samples, to see what % of them contain that call. Or alternatively, just fix the guilty call, clock the speedup, and that will tell you exactly what the wastage was.
You might want to take a look at pycallgraph.
Pycscope does this. I just found it today, so I can’t speak to how good it is, but the few examples I’ve tried have been pretty good (though not perfect).
https://pypi.python.org/pypi/pycscope/
You would use this to generate a cscope file and then a cscope plugin from an editor, VIM specifically. I tried using it with vanilla cscope, it seems that plain cscope gets confused.
It is possible to do it using profiler cProfile in standard library.
In pstats.Stats (the profiler result) there is method print_callees (or alternatively print_callers).
Example code:
import cProfile, pstats
pr = cProfile.Profile()
pr.enable()
# ... do something ...
pr.disable()
ps = pstats.Stats(pr).strip_dirs().sort_stats('cumulative')
ps.print_callees()
Result will be something like:
Function called...
ncalls tottime cumtime
ElementTree.py:1517(_start_list) -> 24093 0.048 0.124 ElementTree.py:1399(start)
46429 0.015 0.041 ElementTree.py:1490(_fixtext)
70522 0.015 0.015 ElementTree.py:1497(_fixname)
ElementTree.py:1527(_data) -> 47827 0.017 0.026 ElementTree.py:1388(data)
47827 0.018 0.053 ElementTree.py:1490(_fixtext)
On the left you have the caller, on the right you have the callee.
(for example _fixtext was called from _data 47827 times and from _start_list 46429 times)
See also:
- docs.python.org/..#print_callees – show call hierarchy. Group by the caller. (used above)
- docs.python.org/..#print_callers – show call hierarchy. Group by the callee.
Couple of notes:
- Your code needs to be edited for this (insert those profile statements).
(i.e. not possible to use from command line likepython -m cProfile myscript.py. Though it is possible to write separate script for that) - A bit unrelated, but
strip_dirs()must go beforesort_stats()(otherwise sorting does not work)